R / Ggplot Geom_histogram - How to make histogram bins start at zero
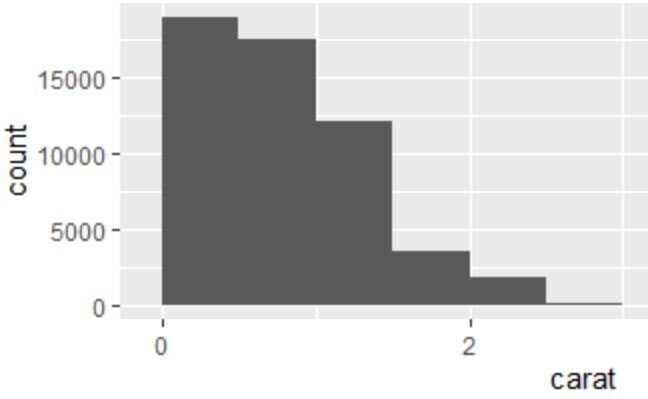
Chapter 5 of R for Data Science by Hadley Wickham [Exploratory Data Analysis] has a geomhistogram for the diamonds dataset where the counts are shown in frequency of 0.5. However, the first bin starts at -0.25. As carats can only be greater than zero, I posted this question on Stackoverflow and got the answer. Here’s the link to the full post while this post explains the answer. https://stackoverflow.com/questions/62009038/r-ggplot-diamonds-dataset-why-does-geom-histogram-for-carat-start-at-negative-bi . Here’s the starting code for the geom_histogram.
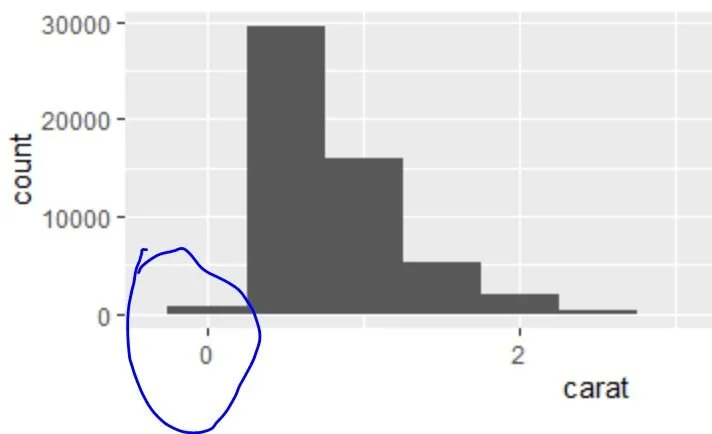
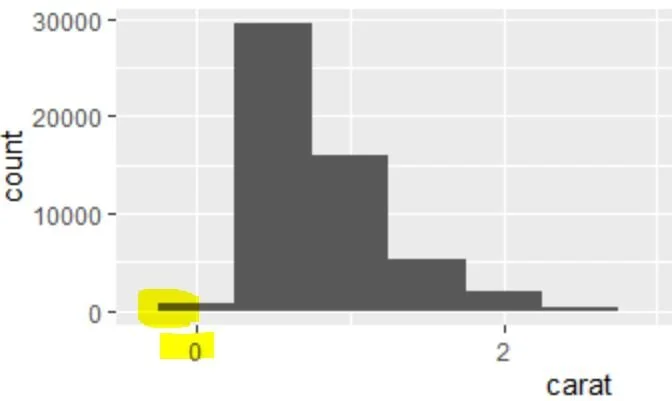
hmm…why should the histogram start at negative values?
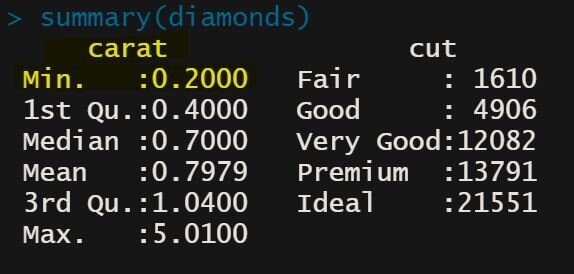
As you can see, the min value is 0.2 for carat.
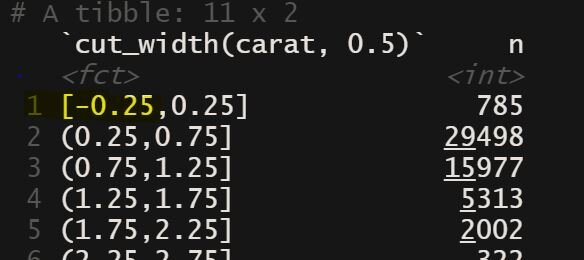
Running the dplyr code shows negative starting point for the first bin.
What the Stackoverflow soluton points out is to the center or boundary parameters in the geomhistogram. If you run, ?geom_histogram(), this is available.
center, boundary:. Only one, center or boundary, may be specified for a single plot. center specifies the center of one of the bins. boundary specifies the boundary between two bins. Note that if either is above or below the range of the data, things will be shifted by the appropriate integer multiple of width. For example, to center on integers use width = 1 and center = 0, even if 0 is outside the range of the data. Alternatively, this same alignment can be specified with width = 1 and boundary = 0.5, even if 0.5 is outside the range of the data.
Applying this to the problem for the diamonds dataset, you could add center parameter to define what should the be the center of a bin [along with binwidth, which says 0.5] OR use boundary to define the edge of a bin.
In diamonds dataset, this would mean that using a centre=0.25 with a bin width = 0.5 would be telling R to go +/- 0.25 in each direction, as a the width is only 0.5.
While using boundary=0 would tell R that the boundary is 0 and the width is 0.5.
In both cases, this would translate to the first bin starting at 0-0.50.
Run both versions of the below code and you’ll get the same answer.
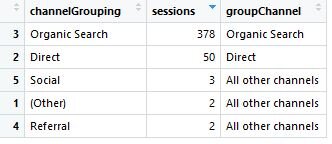
That’s it for this one. you may also check the geom_bar plot with position dodge post. using the diamonds dataset .


![Analyze Day Of Week GA Data via R Programming [Geom_Boxplots]](https://images.squarespace-cdn.com/content/v1/5640e86be4b031347f7c7b81/1597388614762-AEM1BNISZJ71ZVL90JYE/GGplot2+geom_boxplot+with+google+analytics+day+of+week+data.JPG)