Debugging In Adobe Launch
If you’re coming from Google Tag Manager, you’re [like me] spoiled for seeing the preview pane in the lower half of the screen, with all the details on the sequence of events, the tags that got fired, rules met and of course, the dataLayer tab. Well, Adobe Launch has it a bit different. There are ways to make debugging easier.
First things first, always make sure that the build you’re debugging has been compiled by Adobe Launch. It’s easy to miss [been there…] and go about wondering why it’s not adding up. To find it, go to Launch > Publishing > Your build > Scroll to the bottom > Add All Changed Resources > Save and Build Library. This will push the latest version of the library in your environment.

Right there, at the bottom…
Great, once that’s out of the way. Let’s look at the next option in debugging. Adobe Launch works on IFTT [If This Then That] or rather if Rule X is met, I want you to do Y and Z , where Y and Z are tags. Let’s run with an example: You want to know if an Adobe pageview hit got sent. In your Adobe Launch rule for this particular hit, you have the first three actions as usual:
Set the variables [What data do you want to send to Adobe?]
Send the beacon to Adobe [mentioning that it’s a pageview hit]
Clear the variables
Now, fourth action is logging an action in console with any text that you want to see in the Console pane.


Custom Code > Javascript
console.log("adobe - direct call fired");
If you load the page in dev console, you should now see the text in your console log. This text will only show after all previous actions have been met [See the Adobe rule where you had three other actions before this action].

So, this is the most basic method of checking whether an action took place.
Next, let’s look at two Chrome extensions which tell you more detail.
1. Tagtician debugger: https://chrome.google.com/webstore/detail/tagtician-adobe-launch-dt/hiaoiehpkillodoeillmodjcadmfmcbg?hl=en
2. Search Discovery’s debugger: https://chrome.google.com/webstore/detail/launch-and-dtm-switch/nlgdemkdapolikbjimjajpmonpbpmipk?hl=en
I like the Tagtician one slightly better as it has its own tab in dev console which makes it slightly easier to read what’s happening rather than viewing everything in the Console tab.
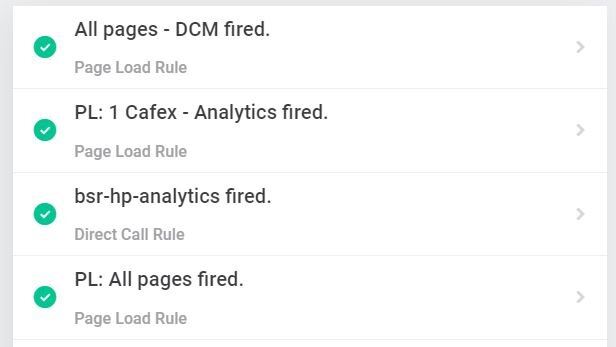
In the Console tag, Search Discovery’s extension can tell you which rules were met [and which ones didn’t] while Tagtician tab in Dev Console tells you which rules were met in a separate tab.

Search Discovery’s extension sharing details on which rules were met. The rocket means that Adobe Launch was used and not DTM.

Dev Console > Tagtician shows details about the rule, the conditions required and he sequence of actions.
Besides looking at third party extensions, you should definitely get the Adobe Cloud Debugger extension. https://chrome.google.com/webstore/detail/adobe-experience-cloud-de/ocdmogmohccmeicdhlhhgepeaijenapj?hl=en . While it won’t tell you which rules did not fire [or why], it’s very helpful in observing hit level data going into Adobe Analytics as it shows you all the sProps , eVars and events that fired. Bonus: Sign into your Adobe account while using Cloud Debugger as it starts showing you the names of sProps/eVars behind the index values. Example: If you’re not logged in, it will only say Prop1 == “ae” while if you’re logged in, it’ll show as Prop 1 - country == “ae”. Same for eVars.
Adobe Cloud Debugger is quite easy to use. It’s best to have it open in a second monitor and see how the session events add up with the variable values that get populated as the hit comes into Adobe Analytics.

Sample hits coming into Cloud Debugger
That’s it for this one. If you have more tips for Adobe Launch, please do let me know via comments. Thanks for reading.