SEO: Web.Dev Vitals - Important User Experience Metrics From Chrome Team
Three weeks ago, the Chrome dev team announced three key vital metrics - that they considered very important for a good user experience. https://blog.chromium.org/2020/05/introducing-web-vitals-essential-metrics.html .
Full details are here: https://web.dev/vitals/
On reading it in detail, it does make sense about the need to have consistent, easy to understand metrics that can be compared across. The announcement also answers the question: What is a good LCP, CLS and FID time?

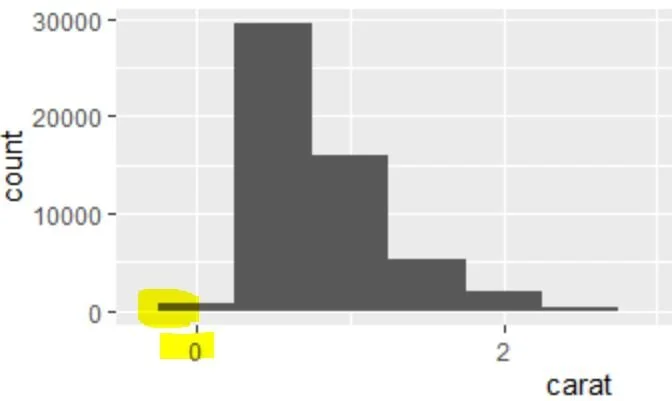
I particularly liked the example of a “loading” icon being shown quickly, only to indicate that the First Contentful Paint was fast indeed [no doubt] but it ignores that other assets could have drained the load time completely. In comparison, Largest Contentful Paint is a better metric to measure. One of the many examples used to explain LCP [this one is the most basic one]. https://web.dev/lcp/

As you can see in the above image, the FCP would show a low timing value but LCP would reveal that the image slowed down the page. With LCP, images and videos are the heaviest aspects of pages. Too many embedded YT videos could use a delay as it needs to access the YT API first to fetch the video title and thumbnail, before it is even played. A workaround for this can be using custom video thumbnails that are just dummies. Once the user clicks to play, it can load the embedded video, thus saving resources and time.
If you’d like to measure this individually for each page, you can get the Chrome extension for Web Dev Vitals https://chrome.google.com/webstore/detail/web-vitals/ahfhijdlegdabablpippeagghigmibma?hl=en
or open up dev console > Audits and run a lighthouse report on it.
The above three metrics will also be on the PSI website soon. The reason why I mention it is because you can use the website to crawl your entire website at scale and pull the metrics via custom extraction, using the Xpath location. Here’s the Screaming Frog link on this: https://www.screamingfrog.co.uk/scaling-pagespeed-insights/ . Summary of the steps and trying it out on my own site: https://analyticslog.com/blog/2018/8/14/screaming-frog-bulk-spider-for-psi?rq=bulk%20crawl .

Essentially, you’re asking Screaming Frog to crawl the PSI dev link instead of your website and copying the XPath location that’s populating these numbers highlighted here.
The web.dev/vitals link has very detailed explanations on the methodology and is worth checking out. There’s already a thread on github on sending this data via GTM. Will test out in GTM and upload a post here.