Geocoding Customer Locations To Produce Google Maps (Bubble Chart) in Data Studio
So, Google Data Studio just launched the Google Maps chart type in Data Studio. As long as your data fields are structured to be understood as Geo type, these can be dragged as dimensions.
There was a recent tweet from GA that caught my attention. You can convert a street address via GeoCoding to get latitude/longitude for it and then plug it into Google Data Studio.
The steps are quite easy:
Have your data in Google Sheets
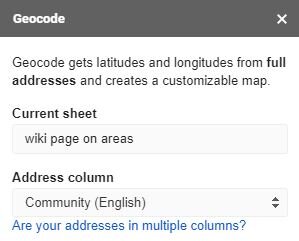
Get GeoCode add-on
Run GeoCode add-on on the column
This will create two additional columns [Latitude and longitude]
Create a custom field in GDS to concat the lat, long as a point on the map
Convert the newly created “lat/long” field to Geo > Lat/Long type in field settings
Choose map type as Google maps, drop the lat/long as dimension and then transactions as your metric.
In testing the above, I used the wiki page to get a List of communities in Dubai. I chose Dubai locations as Middle East (or at least UAE) doesn’t have a zip codes/postal codes that indicate a grid/point on the map. There is Makani number but it’s not popular. In testing the Geocode add-on, we can see the reliability of it in extracting plain text to find locations on the map.
You can then use the IMPORTHTML feature to go to the Wiki page > Access tables > pull the first table.
=IMPORTHTML("https://en.wikipedia.org/wiki/List_of_communities_in_Dubai","table",1)
Cool, you should now have the above data. I added two columns at the end where I run a RANDBETWEEN 0 and 2 for Transactions and RANDBETWEEN (30-80) IF Transactions != 0.
The lat/long columns [Column C and D] will appear when you go to Add ons > GeoCode by Awesome Table > Run Geocode > Choose Community (English) as the field.
Note: The Geocode broke for me while trying to run it directly after IMPORTHTML. To counter this, I pasted the values of the table over itself and then ran a second attempt at GeoCode, it worked.
You should also do a quick sense check of the lat/longs. I sorted them by ascending and found few that were way off on the map or some that were missing. Depending on the scale of the data, you could decide to manually enter the lat/long or remove them from your analysis. I removed 13 entries out of 131 areas, 10% of them. Fair enough.
Go in Data Studio and create a new field by combining the lat/longs here.
Choose chart type as Google Maps.
and voila!
Great! You could take shipping locations of your customer orders and plug them here to get a sense of where are they located. The base of this test was using the Community field to get the lat/long. What happens when you don’t have it separate [in your checkout process]but rather, one long field for address followed by city and country. Let’s try another test with just this and see what happens. I’ll be using some building names as landmark and Community name included in the address field to run a GeoCode test.
Amazing! 80% success rate from the test based on reading community names in the shipping address field (without any zip/postal code).


